 Are you tired of hearing how "simple" it is to deploy apps with Docker Compose, because your experience is more one of frustration? Have you read countless blog posts and forum threads that promised to teach you how to deploy apps with Docker Compose, only for one or more essential steps to be missing, outdated, or broken?
If you're familiar with step-through debugging in PHP apps, you'll know that, while once quite challenging, it has gotten significantly easier in recent years. With the release of XDebug 3 on January 4th, 2021, it's now almost as simple as just setting a breakpoint and reloading a page or making another API request.
But what about when writing Go code?
While I've spent an ever larger amount of time over the last 6-12 months, writing Go code, I've never used step-through debugging with it — until yesterday!
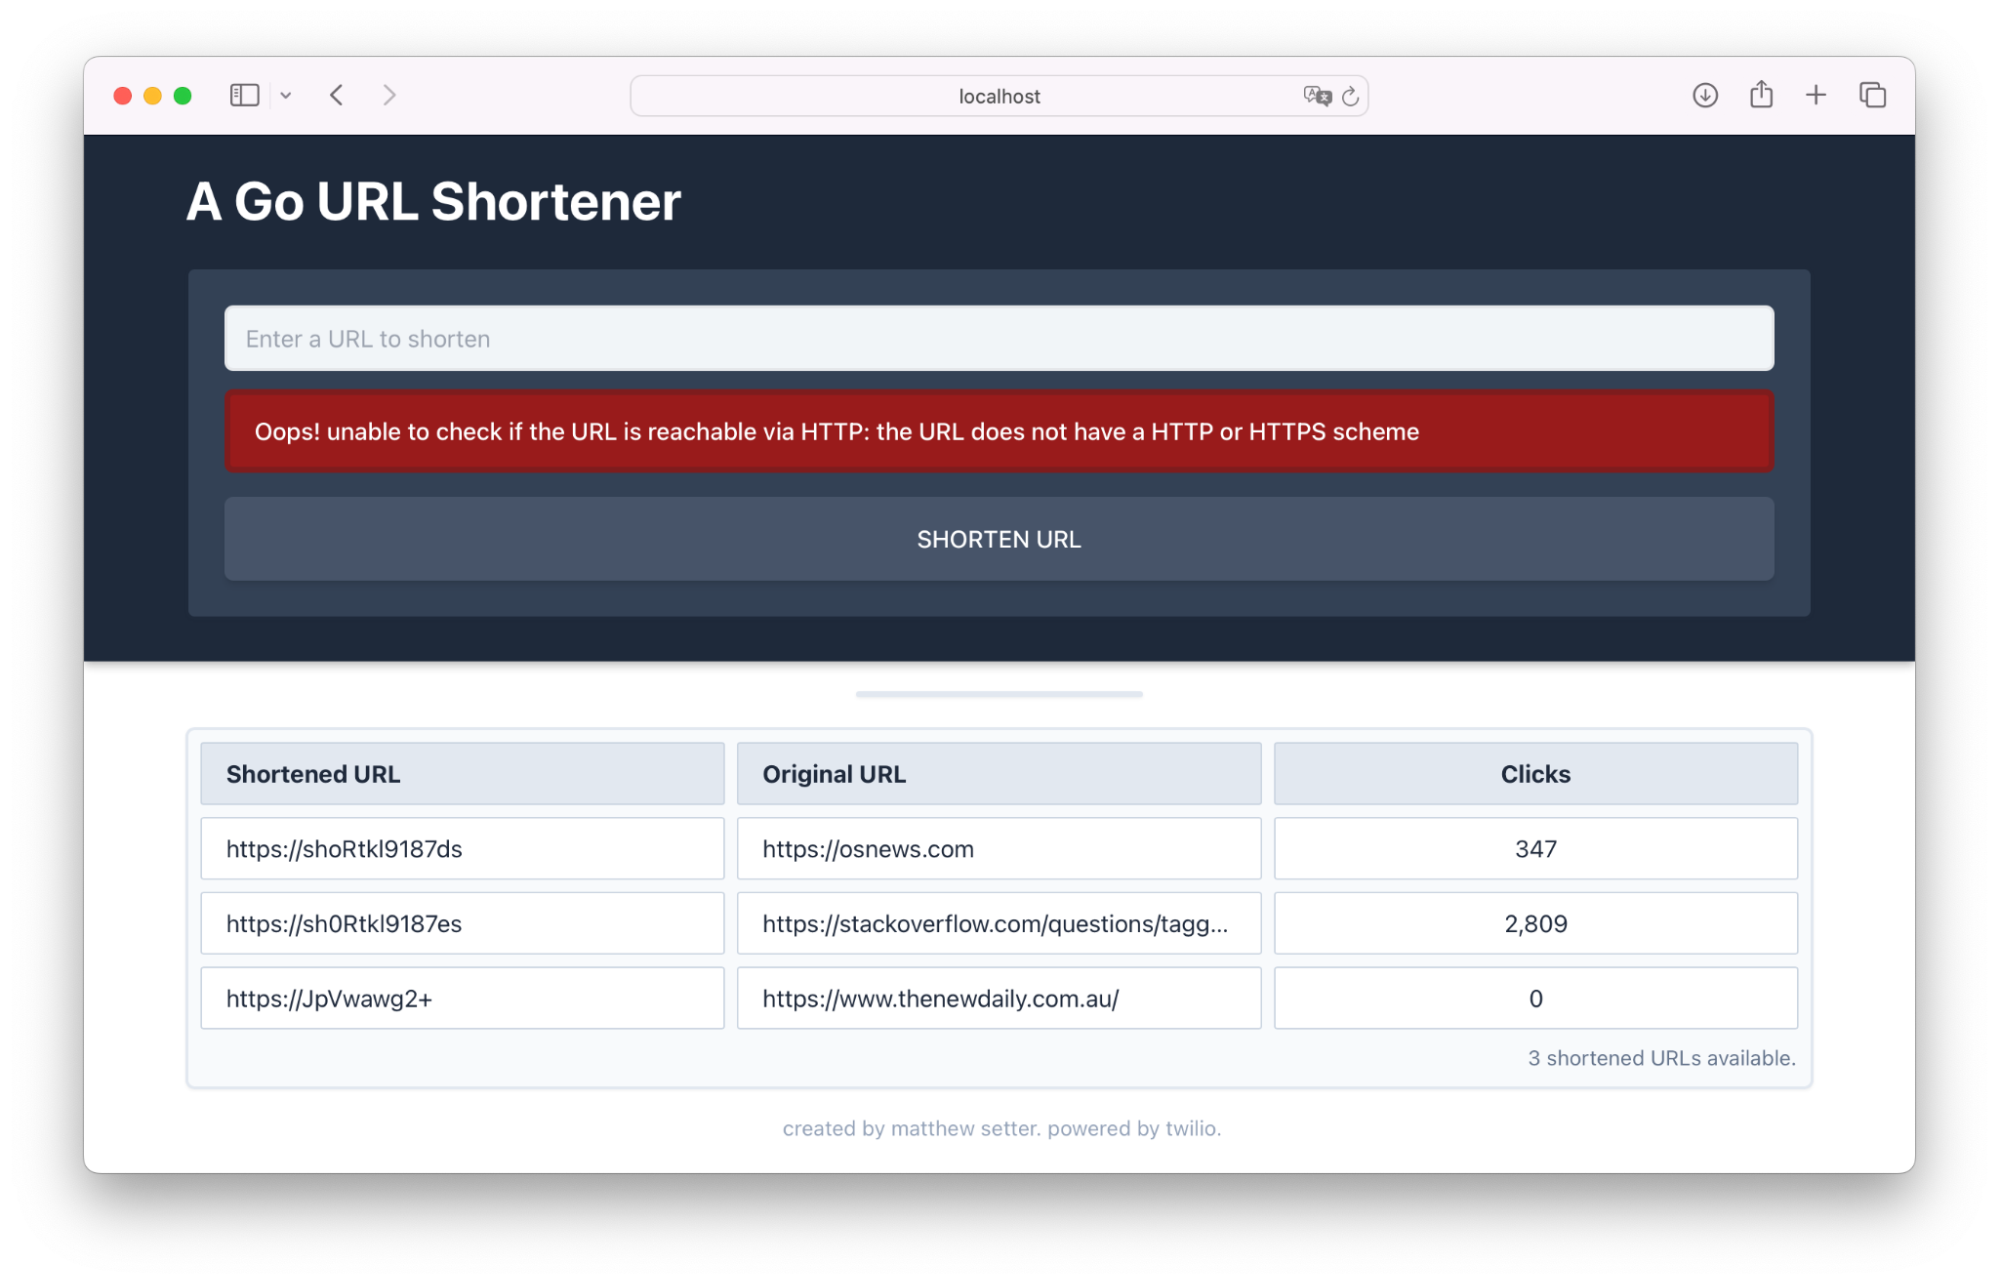
I was working through feedback for an upcoming Twilio tutorial, where the reviewer said that an error message which the app rendered was different to what was stated in the tutorial. Running the app confirmed that he was correct. However, looking at the code suggested otherwise.
Here's what I should have seen:
Given my confusion, I wanted to know what the error message variable contained.
I could have logged the value to the console or to a log file using log.Printf(), but that's a bit of a rough approach.
What's more, the logging code might accidentally be committed to version control, causing confusion at some time in the future.
Given that, I decided to use step-through debugging.
Here's how I got started. Firstly, I checked to make sure that I had a Go debugger installed (Delve comes with VS Code’s Go extension). You can do this by running the following command.
which dlv
If Delve is installed, you'll see the path to it printed to the terminal. If not, follow the installation instructions to install it.
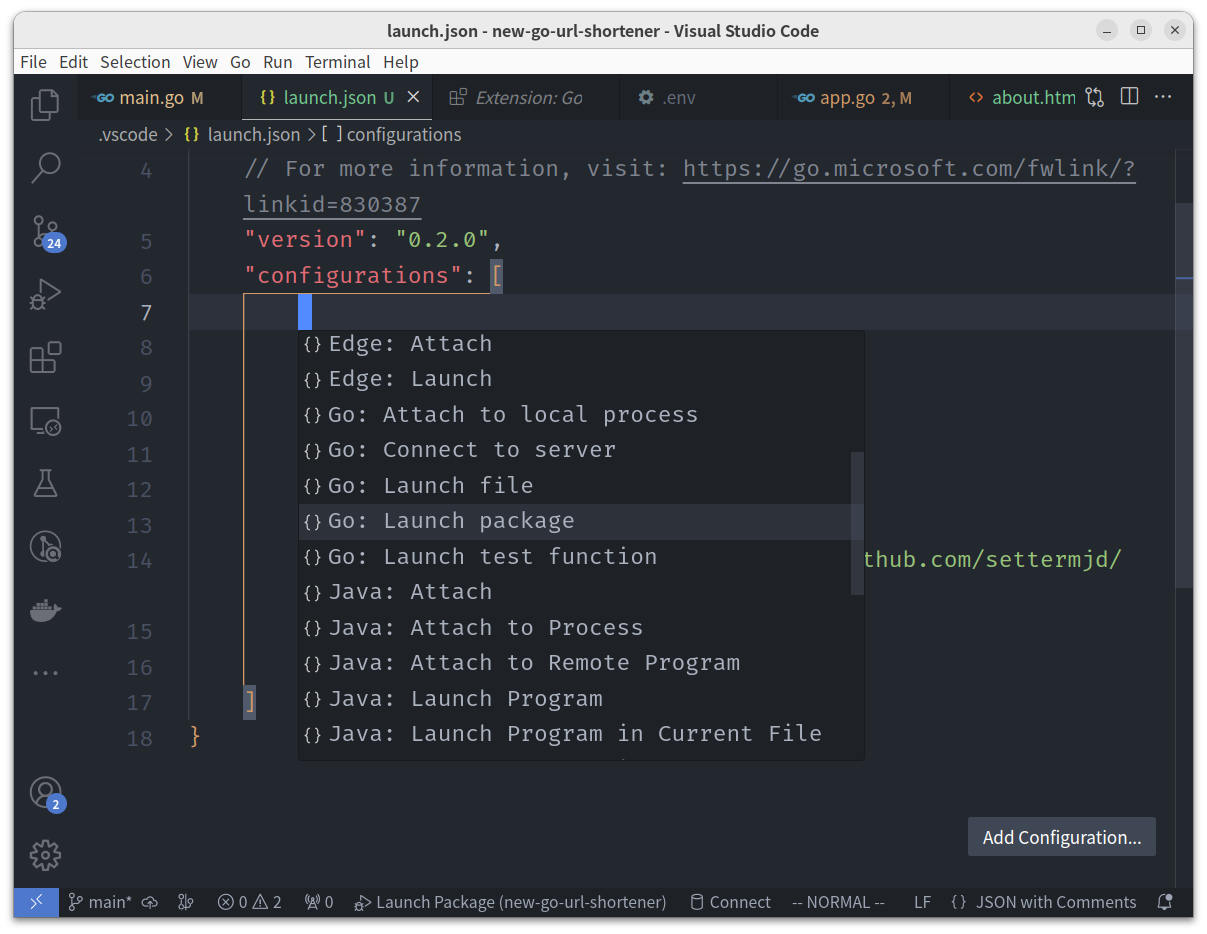
Secondly, I created a debugging launch configuration file; the file’s stored in .vscode/launch.json. I did that by clicking Run > Start Debugging, which provided me with a stub configuration, ready to be expanded. From there, I clicked Add Configuration in the bottom right hand corner, and from the pop-up chose Go: Launch Package.
Then, with the configuration in place and the file saved, I clicked Run > Start Debugging again.
If you’re on macOS you could use ⇧+⌘+P.
If you're using Microsoft Windows, press F5.
Or, if you're using Linux, press Ctrl+Shift+P or F5.
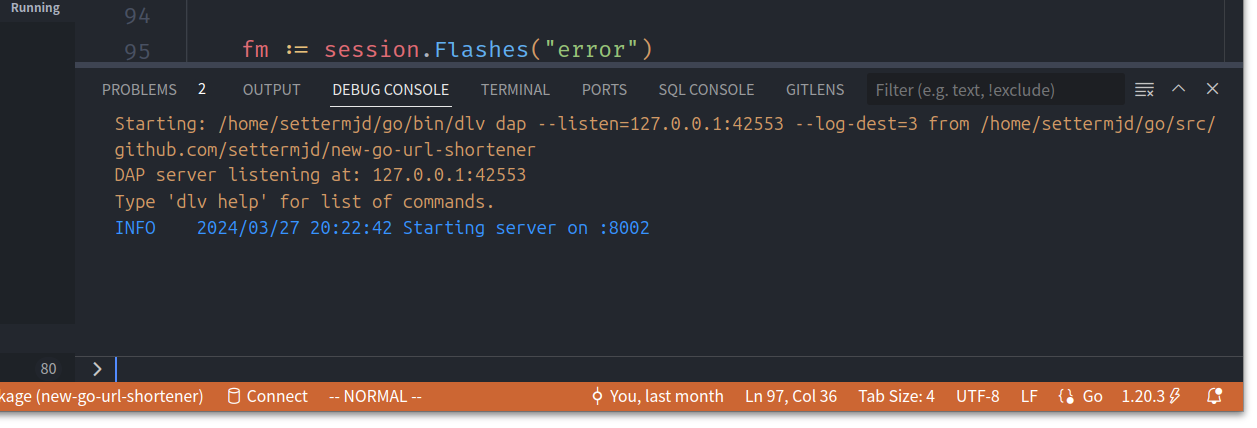
The debug console appeared at the bottom of the main VS Code window, and confirmed that DLV was running and ready.
Then, I enabled a breakpoint on the variable that I wanted to inspect. No point using step-through debugging if you're not going to debug anything.
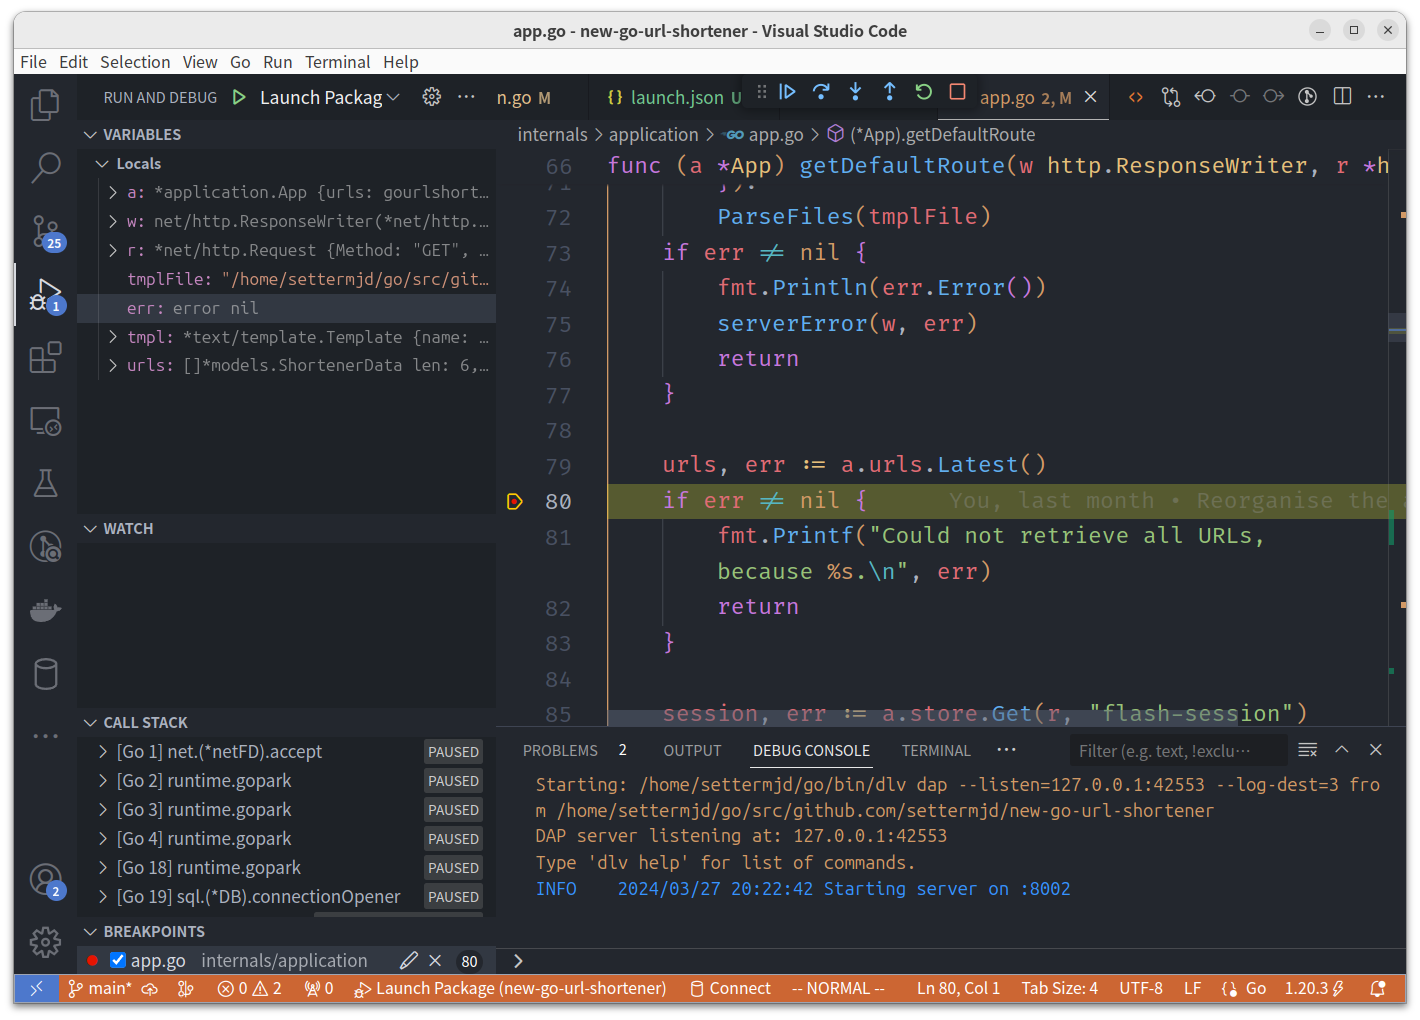
At this point, I could use all of the usual debugging functionality, such as viewing, adding, and removing watches, stopping on breakpoints, stepping-through, stepping into, and stepping over functions.
I was blown away with just how easy it was to use. The way that VS Code changes when you're in debug mode is very intuitive, yet also very familiar.
That’s the essentials of how you start step-through debugging of Go code in Visual Studio Code
A big hat tip from me to the Go and VS Code teams and communities for making the process so easy and feature-rich — and almost trivial to use.
If you want to know what your Go code is doing at a given moment in time, make sure you use this functionality. It’s excellent and very insightful.